All
POWERStudio
우리는 전력 분석기 시리즈 LK601에서 작동 요소와 시각화에 대해 의도적으로 결정했습니다. 대신 기존 파워 미터의 기능을 능가하는 측정 획득 소프트웨어를 개발했습니다. 범위 또는 트리거 설정 여부. POWERStudio에서는 모든 것이 빠르게 액세스할 수 있습니다. 쉽고 빠른 저장 및 불러오기. 다양한 애플리케이션과 테스트 주기를 빠르고 쉽게 시작할 수 있습니다!
모든 측정 데이터는 컴퓨터에서 바로 사용할 수 있습니다. USB 스틱이나 타사 소프트웨어를 통해 데이터를 전송하는 데 시간이 많이 걸리지 않습니다. 광범위한 분석 도구가 충분하지 않은 경우 데이터를 공통 형식으로 내보낼 수 있습니다.
측정 애플리케이션은 매우 개별적입니다. 우리 시스템은 귀하의 요구 사항에 적응합니다. 그 반대가 아닙니다! 사용 가능한 모든 데이터에서 자신만의 라이브 계산을 만들고 필요한 방식으로 표시합니다. E-드라이브 시스템에 맞게 조정하십시오!
-
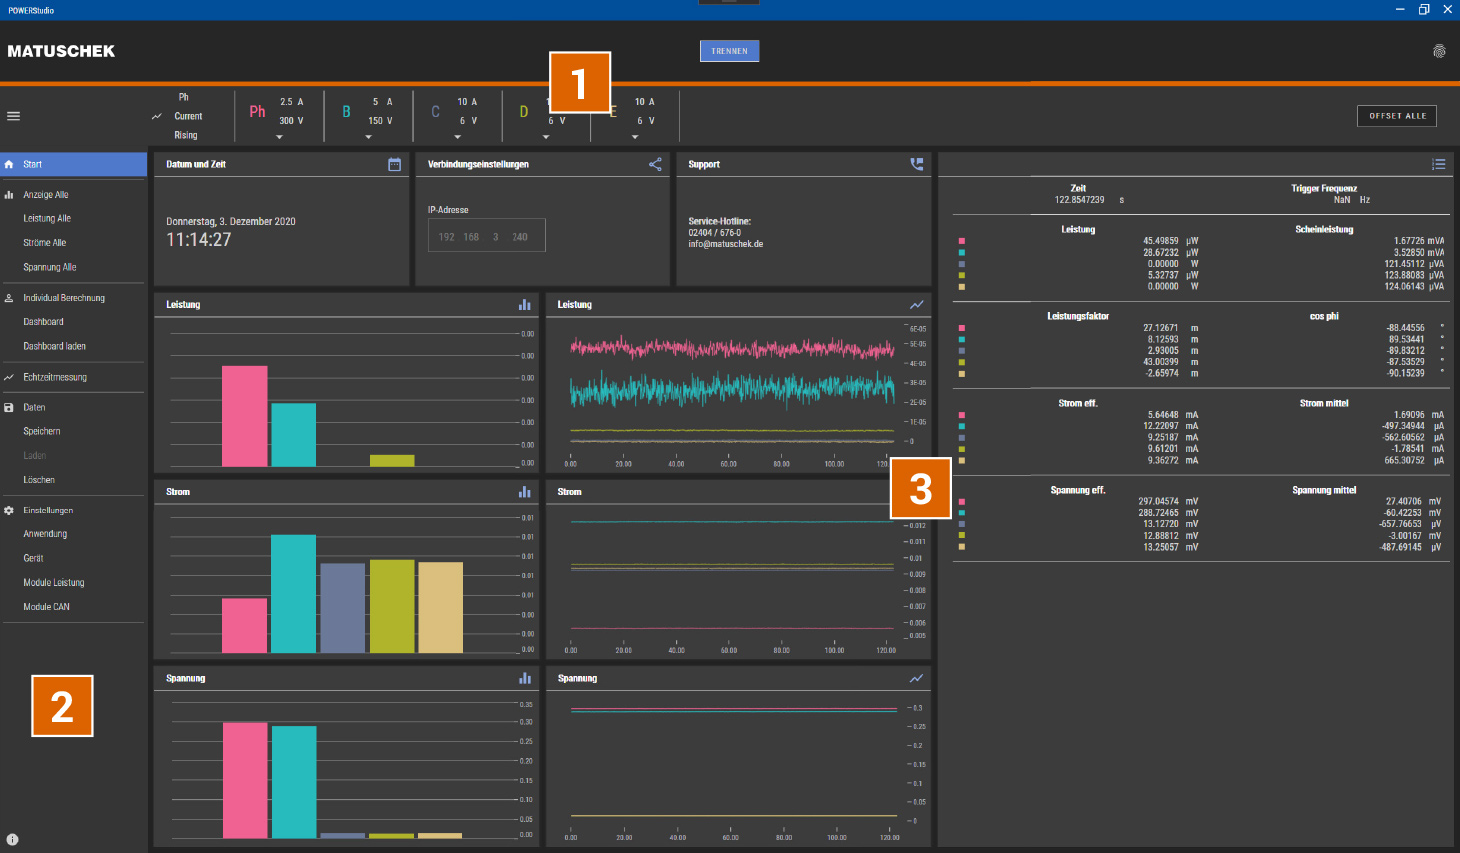

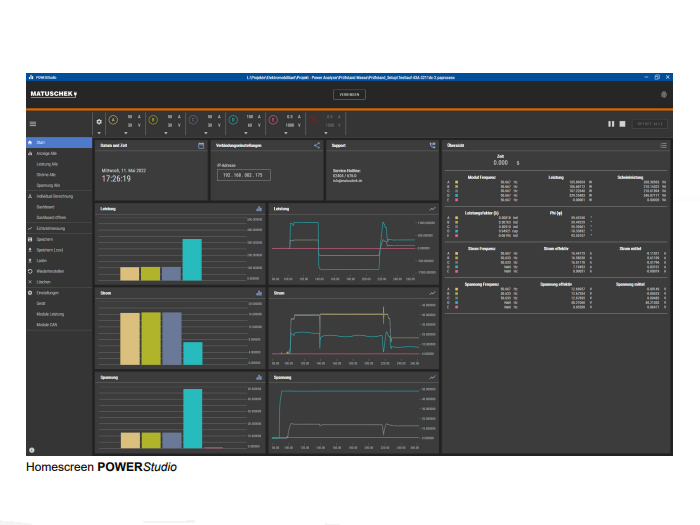
Toolbar
The header located toolbar is always accessible and enables quick changes to all relevant channel and trigger settings.

Navigation
The navigation takes place as you would expect from modern apps. The structure is clear, simple and clearly arranged. All settings are max. 2 click away. Break with endless submenus and hidden settings.

Content
The content is visualized in an appealing and clear manner using a modern tile look. Create your own value dashboards and keep control of your testing environment.
-
User-defined calculations
Describe your test-benchHaving demanding testing applications and requirements, it is not enough to simply record the electrical measured parameters. In case a machine's efficiency needs to be calculated, mechanical and electrical measured values have to be correlated. With our DAQ-Software you have the possibility to create your own calculation rules right from the beginning. You can combine all available data with one another. Whether electrical, CAN- or other data.
- "Live" and/or post-processing calculation
- Freely combine electrical, CAN and other data
- Access to a wide variety of mathematical functions
, ....sin(), min(), max() - Scripting and condition functionality
, ....if, else, >, <, = - Custom display options
Real-time measurement and FFT
Oscilloscope functions by defaultJust because we didn't want to build another oscilloscope doesn't mean you have to give up real-time measurement and FFT frequency analysis. Record current and voltage of all phases in parallel and in real time. With a maximum sampling rate of 10 MSa/s, you can analyze even high-frequency signals with high accuracy.
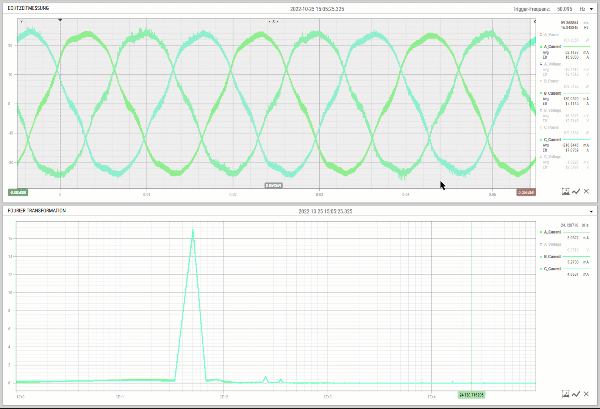
- Parallel recording of up to 6 channels (U + I)
- Adjustable sampling rate up to 10 MSa/s
- 2 GB data memory
- FFT frequency analysis for current, voltage and power signal
- "Live"-functionality (during testing)
- Save, load and export real-time data
- Immediate analysis option in POWERStudio
Efficiency Maps
Determination of Component EfficiencyEfficiency maps provide information about the performance of electrical drive components such as machines or drive inverters. The efficiency of the device under test (DUT) is recorded at various operating points. With respect to drive applications these approached operating points are usually speed and torque. The result is represented by 3D heatmaps whereas the third dimension is the color of the plotted values.
- 3D-Visualization as heatmap
- Data Acquisition by Steady-State-Detection or ext. trigger
- Powerful settings for data averaging and interpolation
- Save-, load- und export maps
- Create automation process via CAN Beta
- Compare and determine deviations from reference
Custom views
No corset = More possibilitiesWhether in research & development or EOL testing. Every test application is different. We offer the opportunity to create your own dashboard views. The custom views can also be applied to a multi-screen system. Measurement values can be linked to each visual UI-element individually. No matter whether electrical values (P, U, I), CAN-data or user-defined calculation values. Fast, intuitive and simple!
- Graphical creation by using DragNDrop
- Individual assignment of measured values
- Saving and loading dasboards
- Variety of visual elements
- Linked analysis functions
- Multi-screen compatible
Analysis Tools
No additional software neededIn classic measurement applications, the acquired data is recorded and then exported manually . These are then manipulated and analyzed using third-party software. Alternatively, measuring devices are also integrated into LabView environments. Either cases involve an enormous amount of time and / or money.
With our POWERStudio software we offer extensive analysis possibilities, which are linked with each other across windows and graphs. Of course, all those tools can also be used in conjunction with our customized user views. On- and offline! Load old measurement data and do your data analysis within your self-created visual environment.

Cursor
You quickly find the precise values and measurement times using the linked data cursor. The cursor is linked to one another across both, graphs and windows.

Averaging
Defining a time window for averaging is quick and easy. All measured values within that window are averaged. Yes, again across graphs and windows.

Zoom
Measurement charts can be enlarged intuitively. The graphs time axes are scaled parallel to one another. No more manually arranged curves.
-
-
 POWERStudio DATASHEET